Excel 2021 Data Visualization with Charts and Graphs: A Complete Guide to Turning Numbers into Insights
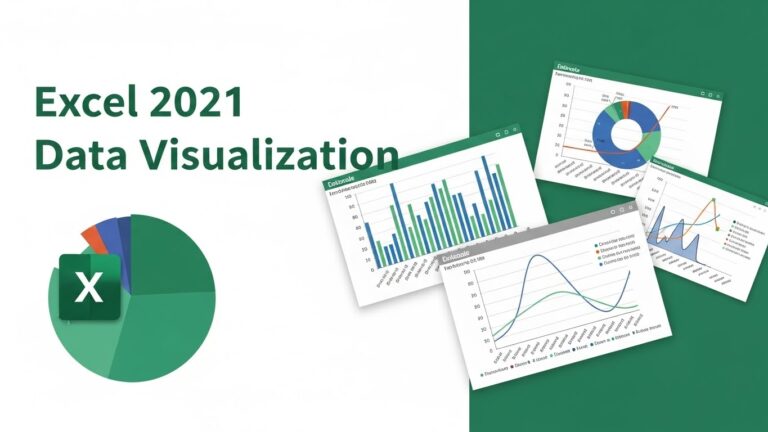
Charts and graphs are the fastest way to make data understandable. A well-built chart can reveal trends, comparisons, and outliers in seconds—things that can take minutes (or hours) to spot in raw tables. Excel 2021 gives you a full toolkit…